告警配置
在部署好 prometheus 及 相关服务的 exporter 后,监控指标数据会存储在 prometheus,通过 grafana 将监控数据可视化展示
下面通过 alertmanager 与 prometheusalert 对接 prometheus 来完成自定义告警指标与告警消息发送
-
alertmanager:用于处理由 prometheus 服务生成的告警,根据配置的规则将告警路由到指定的接收端
-
prometheusalert:一个告警中心消息转发系统,支持从 alertmanager 接收到的告警消息发送到钉钉,企业微信,飞书,email 等
开始部署
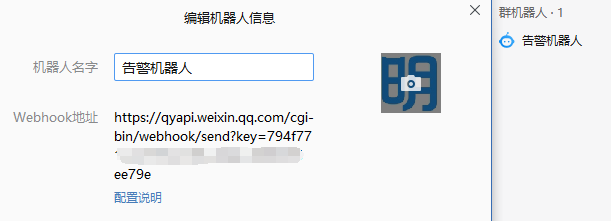
本文档以企微群机器人为接收告警者为例
-
提前获取企微机器人的 webhook 地址
部署 prometheusalert
-
下载 prometheusalert
wget https://github.com/feiyu563/PrometheusAlert/releases/download/v4.9/linux.zip -
解压 prometheusalert 并移至安装目录
unzip linux.zipmv linux /usr/local/prometheusalert -
配置启停脚本
cat > /usr/local/prometheusalert/start_prometheusalert.sh <<EOFnohup cd /usr/local/prometheusalert && ./PrometheusAlert &EOFcat > /usr/local/prometheusalert/stop_prometheusalert.sh <<EOFkill \$(pgrep -f 'PrometheusAlert')EOFchmod +x /usr/local/prometheusalert/start_prometheusalert.shchmod +x /usr/local/prometheusalert/stop_prometheusalert.sh -
修改 prometheusalert 配置文件
编辑
/usr/local/prometheusalert/conf/app.conf文件,默认仅需修改下面几行配置为实际部署信息#登录用户名login_user=prometheusalert#登录密码login_password=******#监听端口httpport = 8085#告警消息标题title=明道云告警推送#默认企业微信机器人地址wxurl=https://qyapi.weixin.qq.com/cgi-bin/webhook/send?key=******- 登陆用户名与密码自定义修改即可
- 监听端口默认8080,可能与服务器上一些常用服务端口冲突,可以自定义修改一下
- 告警消息标题自定义即可
- 默认企微机器人的地址,需修改为实际的地址(如是钉钉、飞书等,按照 app.conf 中默认的注释提示修改即可)
- 如果服务器无法访问互联网,可通过配置
proxy =参数指定正向代理,达到消息推送至外部的需求
-
启动 prometheusalert
cd /usr/local/prometheusalertchmod +x PrometheusAlertbash start_prometheusalert.sh -
将 prometheusalert 加入开机自启动
echo "cd /usr/local/prometheusalert && /bin/bash start_prometheusalert.sh" >> /etc/rc.localchmod +x /etc/rc.local
配置 prometheusalert 告警模板
-
访问
http://$ip:$port登陆 prometheusalert -
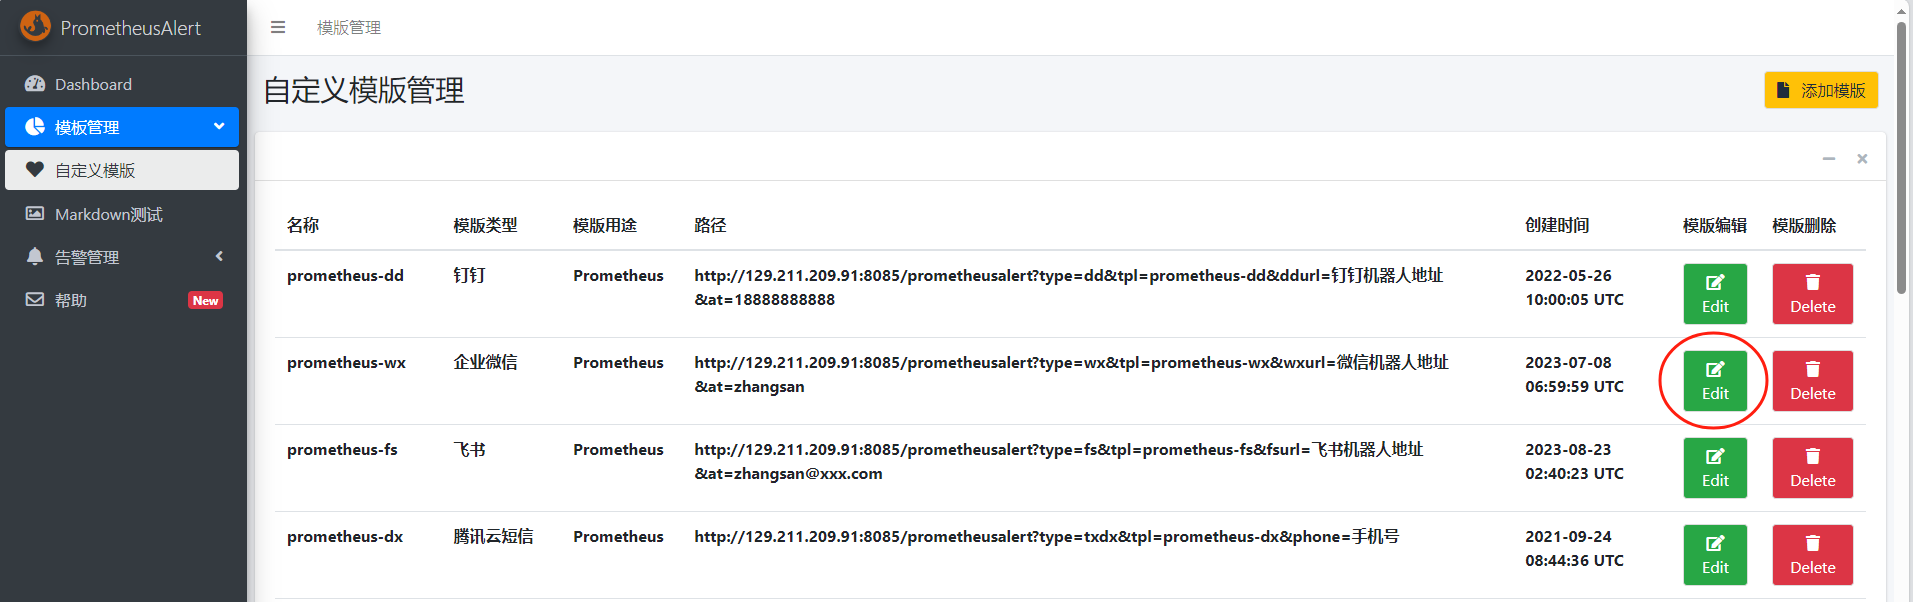
编辑自定义模板
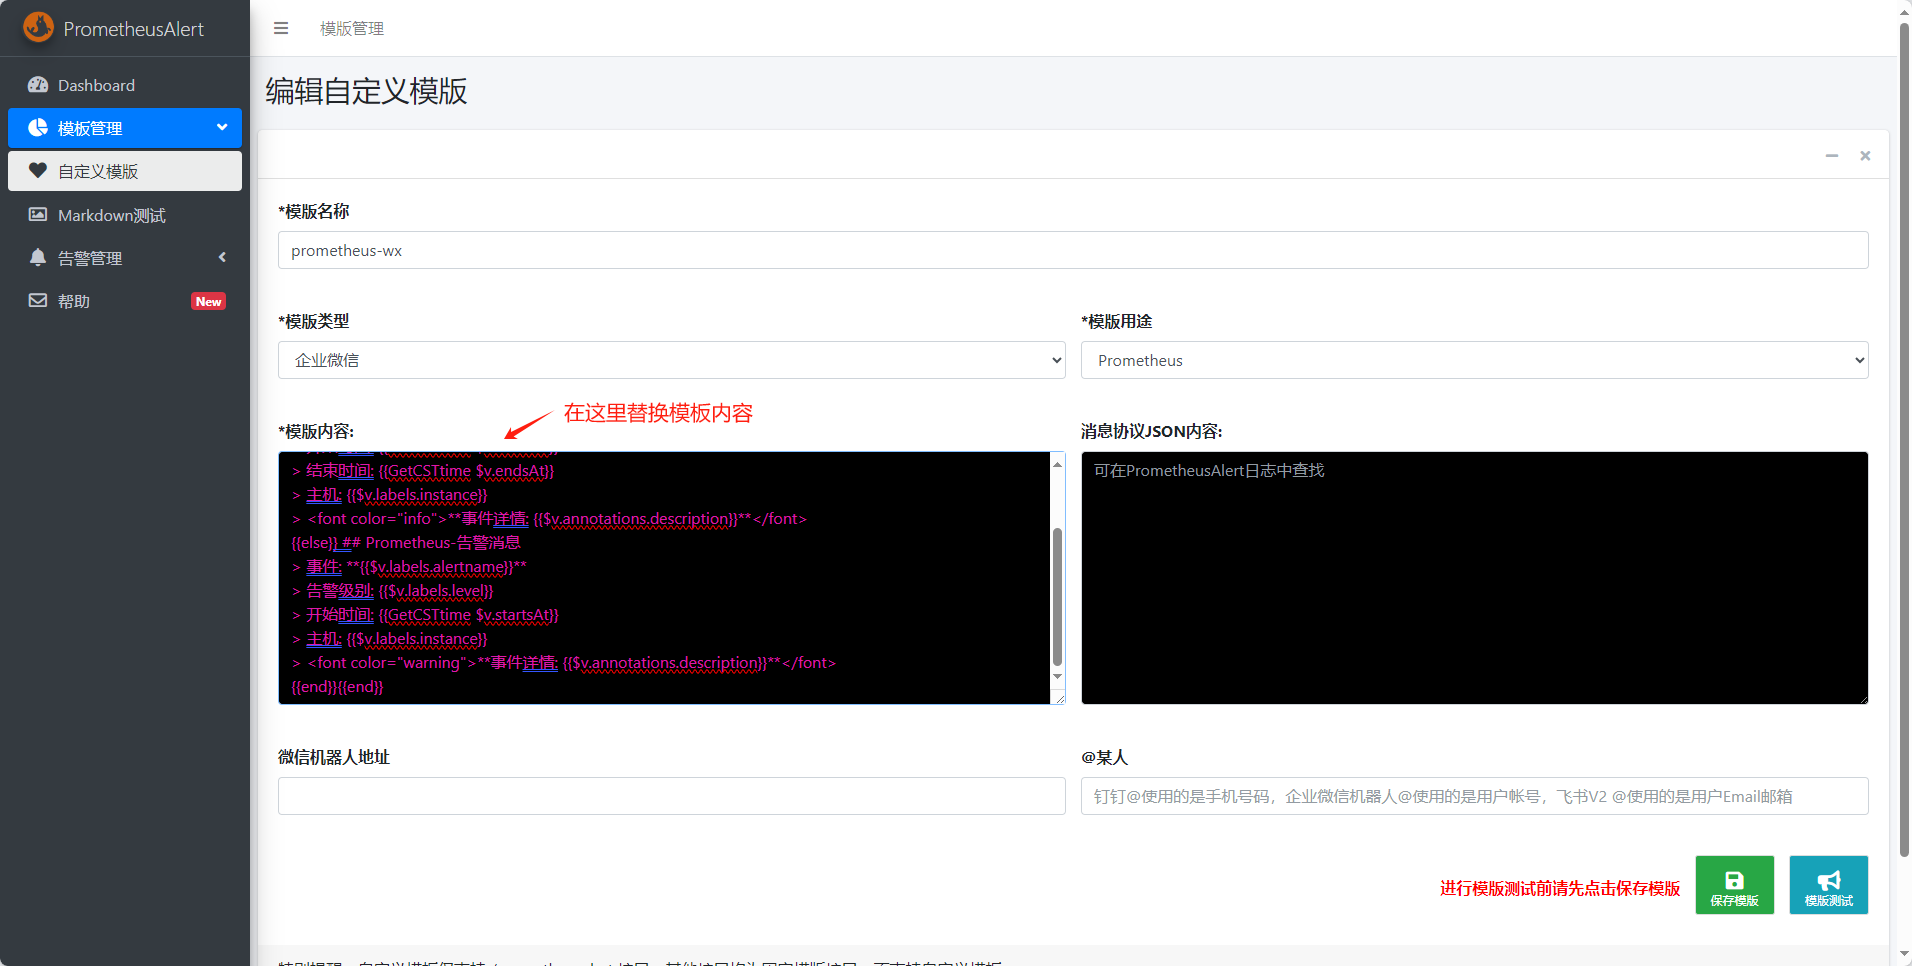
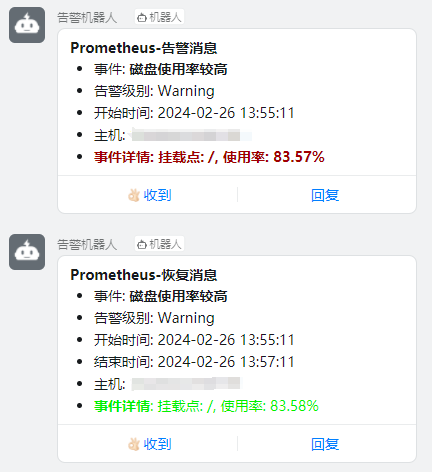
- 企业微信模板内容
- 企业微信告警消息示例
{{ range $k,$v:=.alerts }}{{if eq $v.status "resolved"}} ## Prometheus-恢复消息> 事件: **{{$v.labels.alertname}}**> 告警级别: {{$v.labels.level}}> 开始时间: {{GetCSTtime $v.startsAt}}> 结束时间: {{GetCSTtime $v.endsAt}}> 主机: {{$v.labels.instance}}> <font color="info">**事件详情: {{$v.annotations.description}}**</font>{{else}} ## Prometheus-告警消息> 事件: **{{$v.labels.alertname}}**> 告警级别: {{$v.labels.level}}> 开始时间: {{GetCSTtime $v.startsAt}}> 主机: {{$v.labels.instance}}> <font color="warning">**事件详情: {{$v.annotations.description}}**</font>{{end}}{{end}}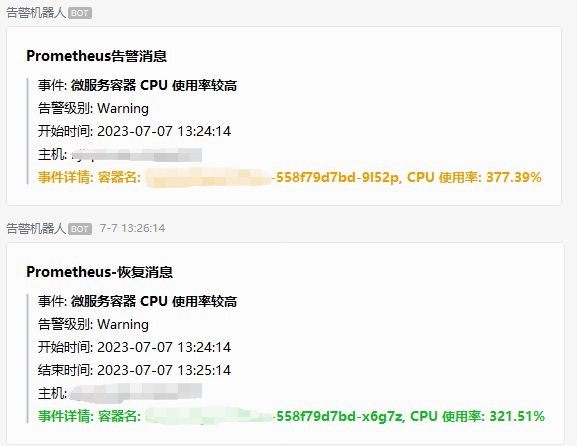
部署 alertmanager
-
下载 alertmanager 安装包
wget https://github.com/prometheus/alertmanager/releases/download/v0.28.1/alertmanager-0.28.1.linux-amd64.tar.gz -
解压并移动到安装目录
tar xf alertmanager-0.28.1.linux-amd64.tar.gzmv alertmanager-0.28.1.linux-amd64 /usr/local/alertmanager -
配置启停脚本
cat > /usr/local/alertmanager/start_alertmanager.sh <<EOFnohup /usr/local/alertmanager/alertmanager --config.file=/usr/local/alertmanager/alertmanager.yml --storage.path=/usr/local/alertmanager/data --log.level=debug &EOFcat > /usr/local/alertmanager/stop_alertmanager.sh <<EOFkill \$(pgrep -f '/usr/local/alertmanager/alertmanager')EOFchmod +x /usr/local/alertmanager/start_alertmanager.shchmod +x /usr/local/alertmanager/stop_alertmanager.sh -
修改
/usr/local/alertmanager/alertmanager.yml配置文件route:group_by: ['instance']group_wait: 30sgroup_interval: 2mrepeat_interval: 4hreceiver: 'web.hook.prometheusalert'receivers:- name: 'web.hook.prometheusalert'webhook_configs:# url 需修改为实际的 prometheusalert 告警接收地址,此 url 地址可在 prometheusalert 的自定义模板的路径字段中获得,&at= 参数默认无需添加- url: 'http://129.211.209.91:8085/prometheusalert?type=wx&tpl=prometheus-wx&wxurl=https://qyapi.weixin.qq.com/cgi-bin/webhook/send?key=******'send_resolved: truealertmanager.yaml 文件内容注释
route:group_by: ['instance'] # 根据告警名称进行分组group_wait: 30s # 收到第一个分组告警后,等待 30 秒再发送该分组(这 30 秒用于等待同一分组内的其他告警一起发送)group_interval: 2m # 收到相同分组的新告警后,等待 2 分钟后解除冷却,再次发送该分组的消息repeat_interval: 4h # 当一个分组的告警持续存在时,至少冷却 4 小时后才能重复发送该分组的告警receiver: 'web.hook.prometheusalert' # 将告警消息发送给名为 'web.hook.prometheusalert' 的接收器receivers:- name: 'web.hook.prometheusalert' # 接收器的名称为 'web.hook.prometheusalert'webhook_configs:- url: 'http://129.211.209.91:8085/prometheusalert?type=wx&tpl=prometheus-wx&wxurl=https://qyapi.weixin.qq.com/cgi-bin/webhook/send?key=******' # 使用 Webhook 将告警发送至 prometheusalertsend_resolved: true # 也发送已解决的告警- url 中各参数详细解释可见官方文档
-
启动 alertmanager
cd /usr/local/alertmanagerbash start_alertmanager.sh -
将 alertmanager 加入开机自启动
echo "cd /usr/local/alertmanager && /bin/bash start_alertmanager.sh" >> /etc/rc.localchmod +x /etc/rc.local
配置 prometheus 告警规则
-
修改 prometheus.yaml
alerting:alertmanagers:- static_configs:- targets:- 10.206.0.6:9093rule_files:- 'alert_rules/*.yml'- targets 值需修改为实际的 alertmanager 服务地址
-
创建告警规则文件存放目录
mkdir /usr/local/prometheus/alert_rules -
创建告警规则文件
服务器主机
vim /usr/local/prometheus/alert_rules/host.yml默认告警规则如下:
groups:# CPU 使用率持续 3m 达到 90% 及以上- name: HostCPUrules:- alert: CPU使用率较高expr: 100 * (1 - avg(irate(node_cpu_seconds_total{mode="idle"}[2m])) by (instance)) > 90for: 3mlabels:level: Warningannotations:description: "服务器CPU当前使用率较高,当前使用率: {{ $value | printf \"%.2f\" }}%"# 内存使用率持续 3m 达到 90% 及以上- name: HostMEMrules:- alert: 内存使用率较高expr: (1 - (node_memory_MemAvailable_bytes / (node_memory_MemTotal_bytes)))* 100 > 90for: 3mlabels:level: Warningannotations:description: "服务器内存当前使用率较高,当前使用率: {{ $value | printf \"%.2f\" }}%"# / 与 /data 目录使用率持续 3m 达到 90% 及以上- name: Diskrules:- alert: 磁盘使用率较高expr: 100 * ((node_filesystem_size_bytes{fstype=~"xfs|ext4"} - node_filesystem_avail_bytes) / node_filesystem_size_bytes {mountpoint=~"/|/data"}) > 90for: 3mlabels:level: Warningannotations:description: "挂载点: {{$labels.mountpoint}}, 使用率: {{ $value | printf \"%.2f\" }}%"微服务容器
vim /usr/local/prometheus/alert_rules/service.yml默认告警规则如下:
groups:# 容器 CPU 使用率持续 3m 达到 800%- name: ServiceCPUrules:- alert: 微服务容器 CPU 使用率较高expr: irate(container_cpu_usage_seconds_total{container!="",pod!="",namespace="default"}[2m])*100 > 500for: 3mlabels:level: Warningannotations:description: "容器名: {{$labels.pod}}, CPU 使用率: {{ $value | printf \"%.2f\" }}%"# 容器内存持续 3m 占用 5G- name: ServiceMEMrules:- alert: 微服务容器内存占用较高expr: container_memory_working_set_bytes{namespace="default"} / 1073741824 > 5for: 3mlabels:level: Warningannotations:description: "容器名: {{$labels.pod}}, 内存占用: {{ $value | printf \"%.2f\" }}G"- 在实际环境中,您可能需要调整默认的告警规则,规则中通过 PromQL 表达式从 prometheus 中查询数据,或参考本文档下方的更多告警规则来优化您环境中的规则。
-
重载 prometheus 以生效修改后的配置
更多帮助
告警模板
飞书
- 飞书模板内容
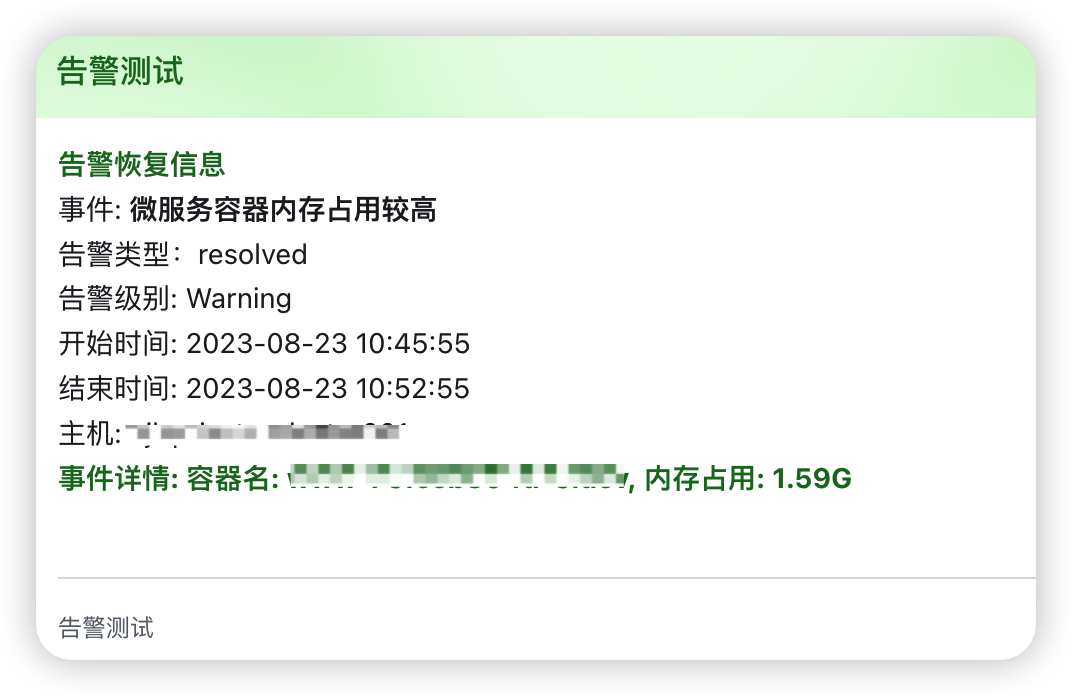
- 飞书告警消息示例
{{ range $k,$v:=.alerts }}{{if eq $v.status "resolved"}}<font color="green">**告警恢复信息**</font>
事件: **{{$v.labels.alertname}}**
告警类型:{{$v.status}}
告警级别: {{$v.labels.level}}
开始时间: {{GetCSTtime $v.startsAt}}
结束时间: {{GetCSTtime $v.endsAt}}
主机: {{$v.labels.instance}}
<font color="green">**事件详情: {{$v.annotations.description}}**</font>
{{else}}**告警信息**
事件: **{{$v.labels.alertname}}**
告警类型�:{{$v.status}}
告警级别: {{$v.labels.level}}
开始时间: {{GetCSTtime $v.startsAt}}
主机: {{$v.labels.instance}}
<font color="red">**事件详情: {{$v.annotations.description}}**</font>
{{end}}
{{ end }}

钉钉
- 钉钉模板内容
- 钉钉告警消息示例
{{ range $k,$v:=.alerts }}{{if eq $v.status "resolved"}}
#### Prometheus-恢复消息
- 事件: **{{$v.labels.alertname}}**
- 告警级别: {{$v.labels.level}}
- 开始时间: {{GetCSTtime $v.startsAt}}
- 结束时间: {{GetCSTtime $v.endsAt}}
- 主机: {{$v.labels.instance}}
- <font color="info">**事件详情**: {{$v.annotations.description}}</font>
{{else}}
#### Prometheus-告警消息
- 事件: **{{$v.labels.alertname}}**
- 告警级别: {{$v.labels.level}}
- 开始时间: {{GetCSTtime $v.startsAt}}
- 主机: {{$v.labels.instance}}
- <font color="warning">**事件详�情: {{$v.annotations.description}}**</font>
{{end}}{{end}}
修改 prometheusalert 服务的 conf/app.conf ,配置邮件服务,如下所示
#---------------------↓邮件配置-----------------------
#是否开启邮件
open-email=1
#邮件发件服务器地址
Email_host=smtp.qq.com
#邮件发件服务器端口
Email_port=465
#邮件帐号
Email_user=123456789@qq.com
#邮件密码
Email_password=xxxxxxx
#邮件标题
Email_title=运维告警
#默认发送邮箱
Default_emails=123456@qq.com,123456@baidu.com
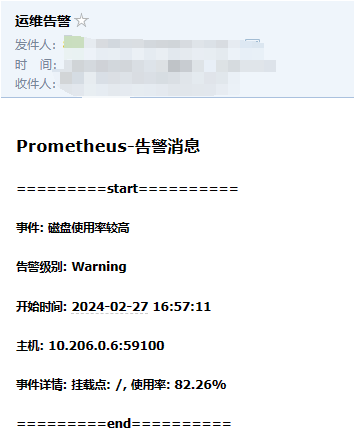
- Email模板内容
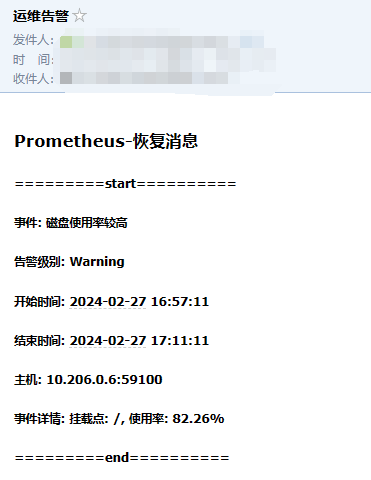
- Email告警消息示例
{{ range $k,$v:=.alerts }}{{if eq $v.status "resolved"}}
<h3> Prometheus-恢复消息 </h3>
<h5>=========start==========</h5>
<h5>事件: {{$v.labels.alertname}}</h5>
<h5>告警级别: {{$v.labels.level}}</h5>
<h5>开始时间: {{GetCSTtime $v.startsAt}}</h5>
<h5>结束时间: {{GetCSTtime $v.endsAt}}</h5>
<h5>主机: {{$v.labels.instance}}</h5>
<h5>事件详情: {{$v.annotations.description}}</h5>
<h5>=========end==========</h5>
{{else}}
<h3> Prometheus-告警消息 </h3>
<h5>=========start==========</h5>
<h5>事件: {{$v.labels.alertname}}</h5>
<h5>告警级别: {{$v.labels.level}}</h5>
<h5>开始时间: {{GetCSTtime $v.startsAt}}</h5>
<h5>主机: {{$v.labels.instance}}</h5>
<h5>事件详情: {{$v.annotations.description}}</h5>
<h5>=========end==========</h5>
{{end}}{{end}}
告警规则
排除 worksheetonlyworkflow、basic 等容器,其他容器 CPU 使用率持续 3m 达到 500%
- name: ServiceCPU-Rule-Exclude
  rules:
  - alert: 微服务容器CPU使用率较高
    expr: irate(container_cpu_usage_seconds_total{container!~"worksheetonlyworkflow|basic|basiconlyworkflow|workflowconsumer|command",pod!="",namespace="default"}[2m])*100 > 500
    for: 3m
    labels:
      level: Warning
    annotations:
      description: "容器名: {{$labels.pod}}, CPU 使用率: {{ $value | printf \"%.2f\" }}%"
指定 worksheetonlyworkflow、basic 等容器,CPU 使用率持续 3m 达到 800%
- name: ServiceCPU-Rule-Specify
  rules:
  - alert: 微服务容器CPU使用率较高
    expr: irate(container_cpu_usage_seconds_total{container=~"worksheetonlyworkflow|basic|basiconlyworkflow|workflowconsumer|command",pod!="",namespace="default"}[2m])*100 > 800
    for: 3m
    labels:
      level: Warning
    annotations:
      description: "容器名: {{$labels.pod}}, CPU 使用率: {{ $value | printf \"%.2f\" }}%"
排除 basic、basiconlyworkflow 等容器内存持续 3m 占用 5G
- name: ServiceMemory-Rule-Exclude
  rules:
  - alert: 微服务容器内存占用较高
    expr: container_memory_working_set_bytes{container!~"basic|basiconlyworkflow|api|wwwapi|worksheetexcelapi|worksheetexcelapiconsumer|command|datapipeline|workflowconsumer|workflowrouterconsumer",namespace="default"} / 1073741824 > 5
    for: 3m
    labels:
      level: Warning
    annotations:
      description: "容器名: {{$labels.pod}}, 内存占用: {{ $value | printf \"%.2f\" }}G"
指定 basic、basiconlyworkflow 等容器内存持续 3m 占用 8G
- name: ServiceMemory-Rule-Specify
  rules:
  - alert: 微服务容器内存占用较高
    expr: container_memory_working_set_bytes{container=~"basic|basiconlyworkflow|api|wwwapi|worksheetexcelapi|worksheetexcelapiconsumer|command|datapipeline",namespace="default"} / 1073741824 > 8
    for: 3m
    labels:
      level: Warning
    annotations:
      description: "容器名: {{$labels.pod}}, 内存占用: {{ $value | printf \"%.2f\" }}G"